Same venues.Same phone numbers.Same teams.2.9× the bookings.
How BHC’s switch from Slang to Tablevoice transformed the results of its phone AI across 14 venues.
Equal 30-day windows around each venue’s switch; launch day, known tests and no-shows excluded. See methodology.
01 / The decision
BHC already knew what phone AI could do.
A migration between providers.
Fourteen existing venues.
A higher standard for hospitality.
The opportunity was to find out how much better it could be.
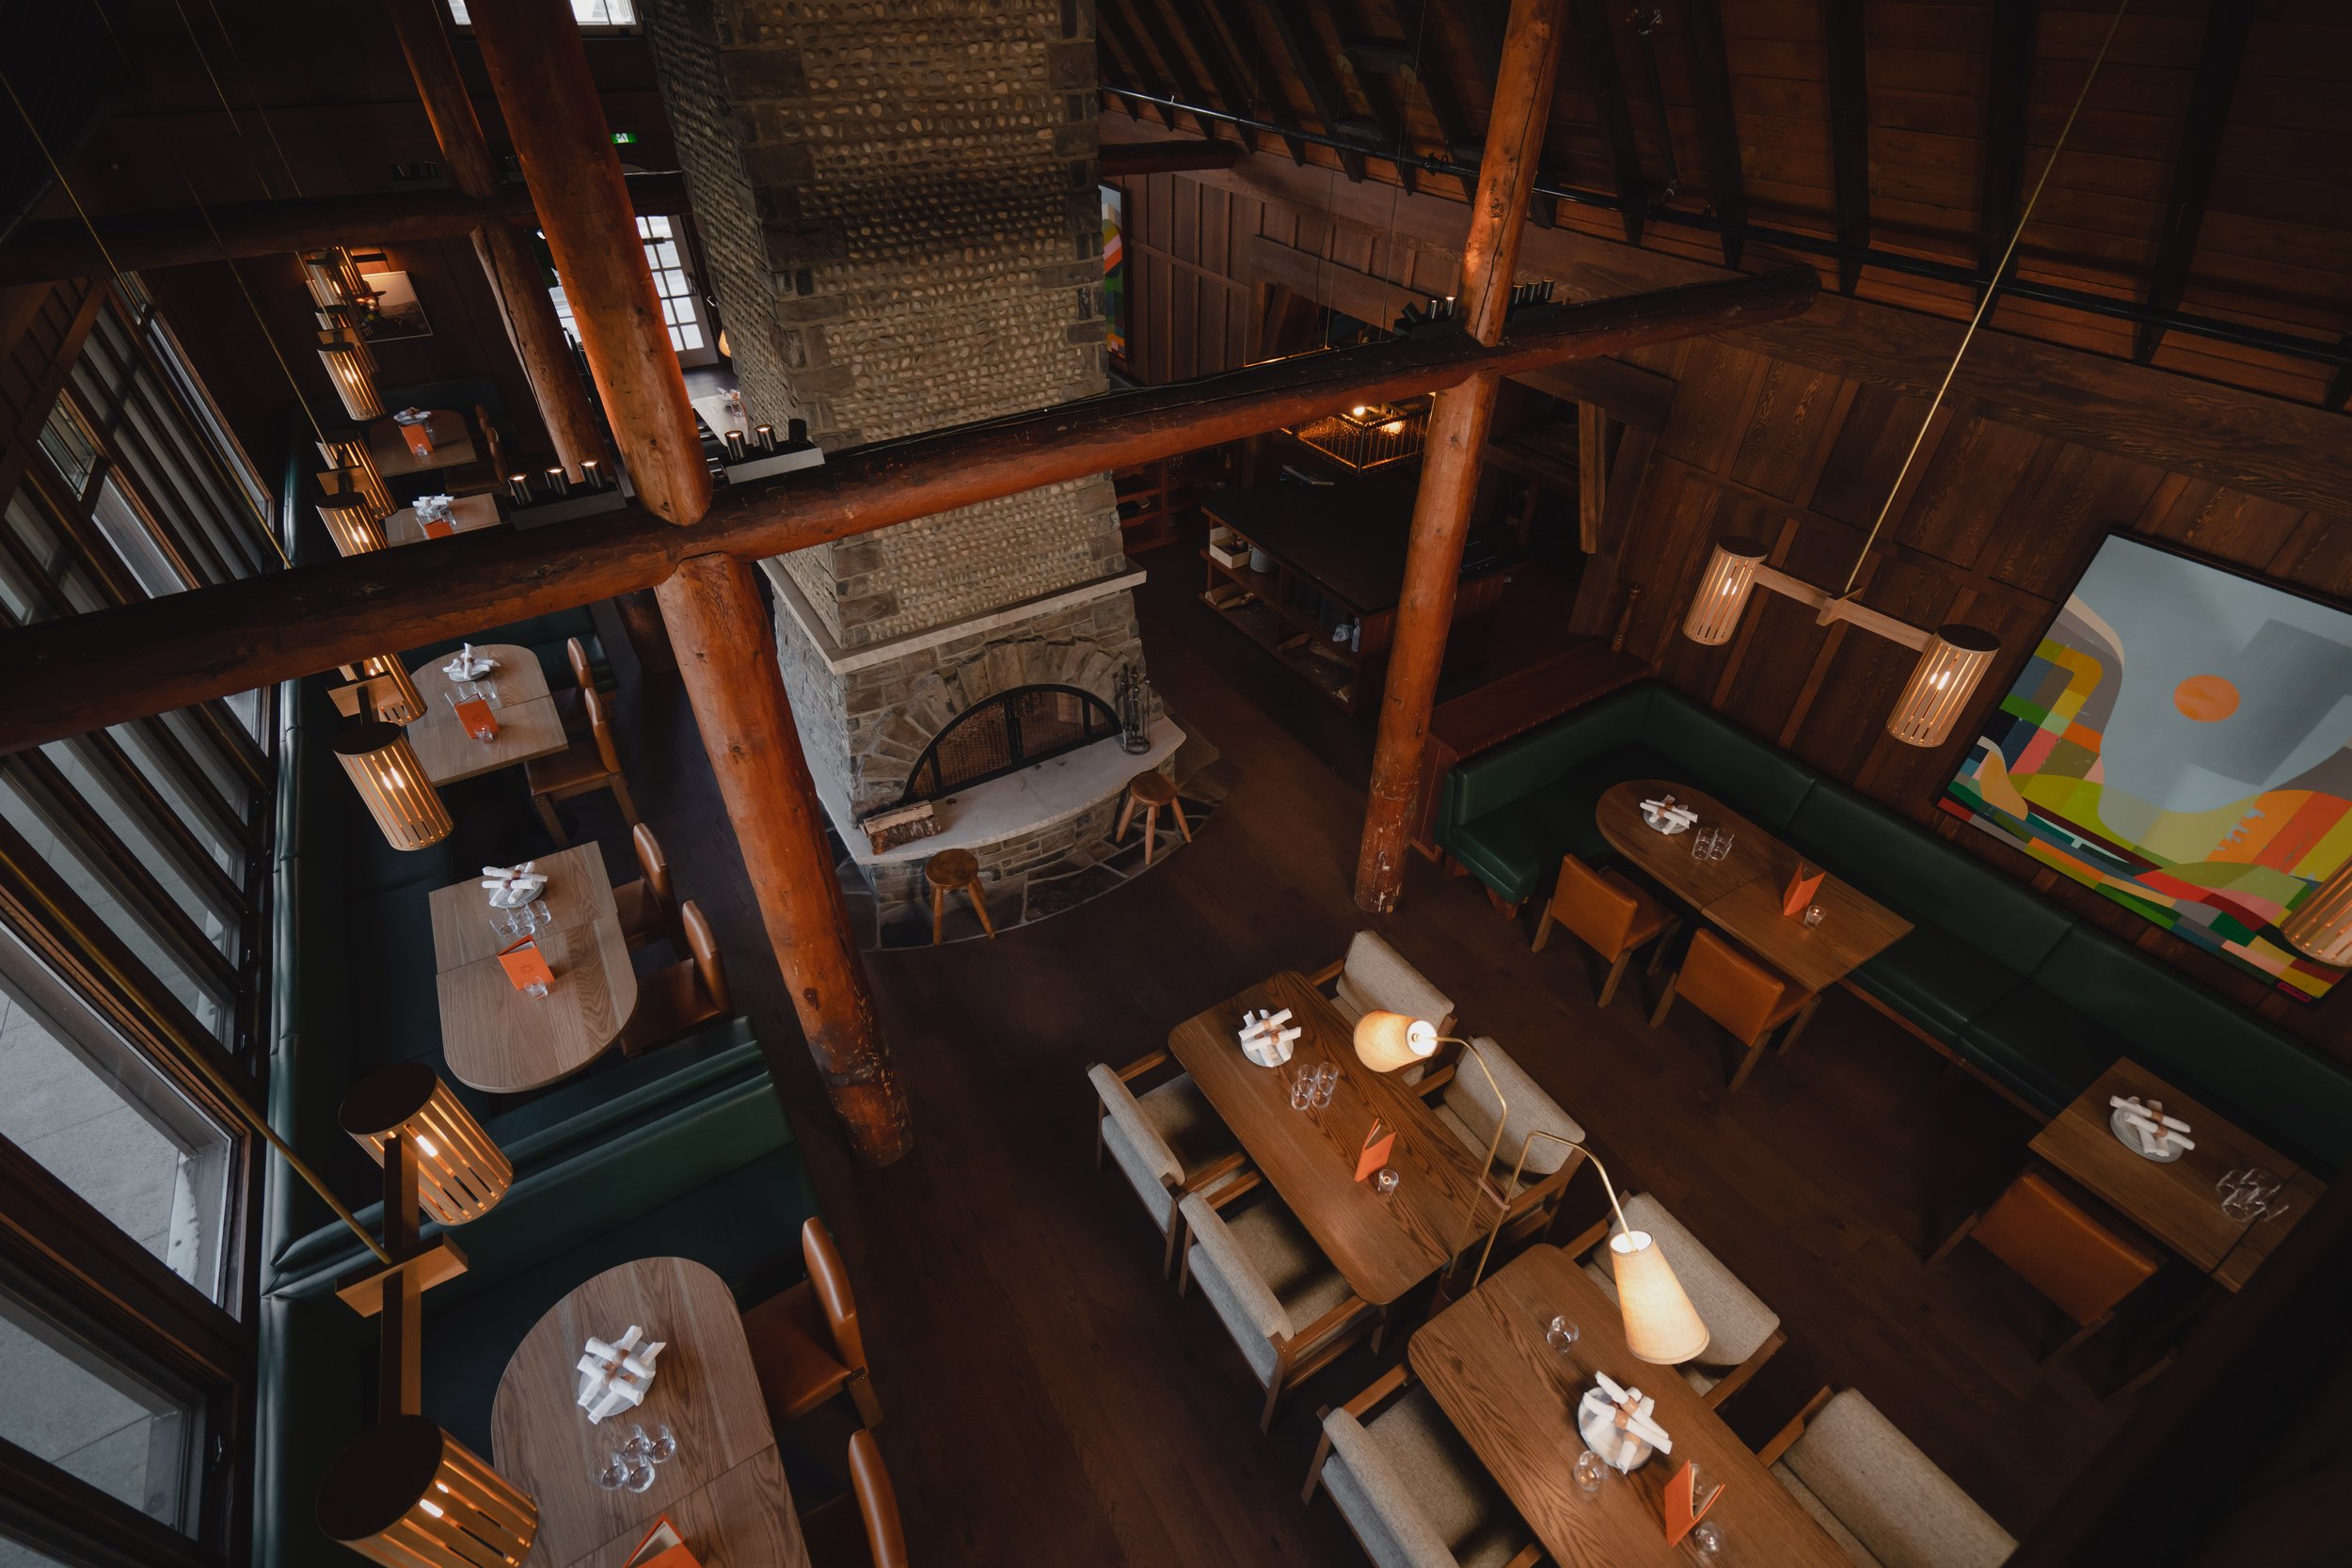
Banff Hospitality Collective brings together venues with very different personalities: Italian dining at LUPO, woodfired cooking at Bluebird, craft beer at Three Bears, and bowling at High Rollers. Each has its own rhythms, booking rules and guest expectations.
BHC had already adopted Slang for phone AI. As its teams gained experience, they developed a clearer view of what they needed: thoughtful conversations, an understanding of each venue’s offering, and a partner willing to work through the details with them.
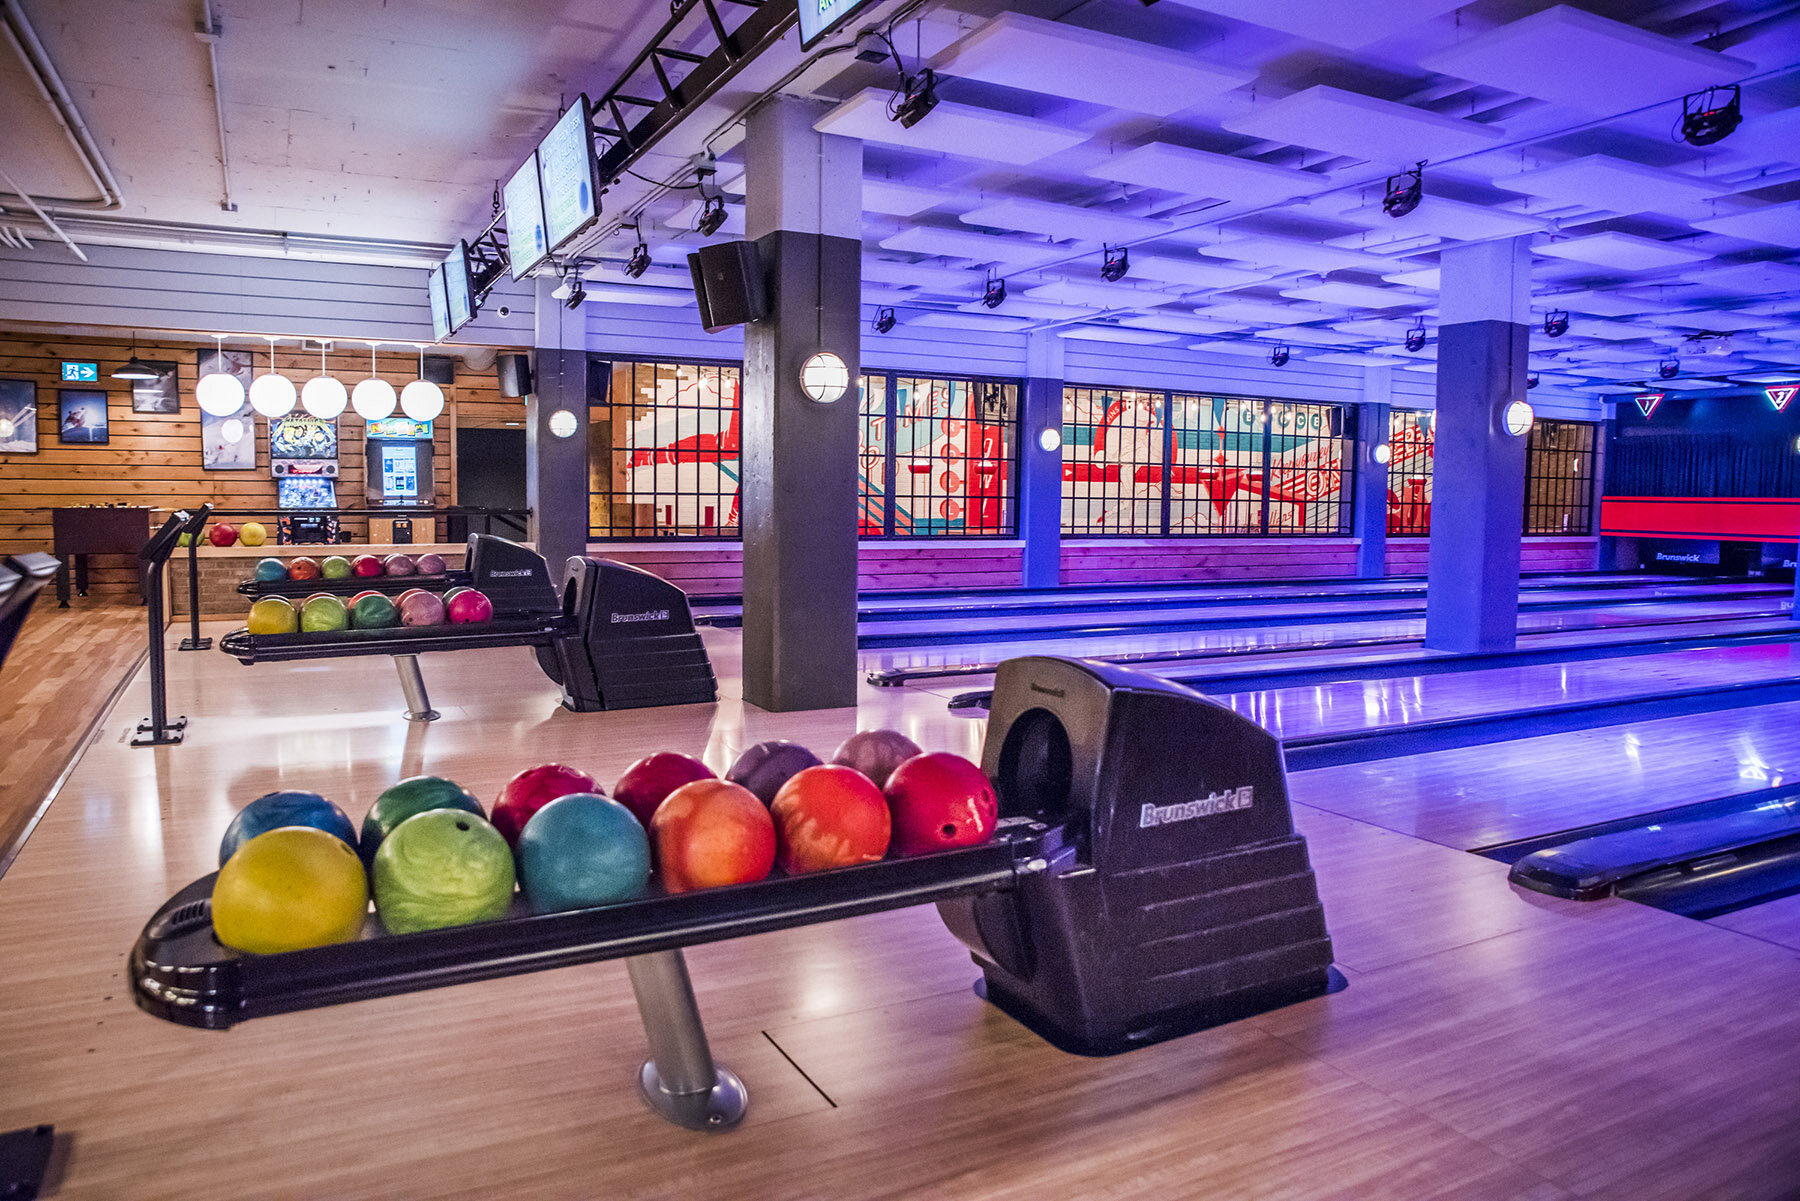
Tablevoice began at High Rollers on April 1, 2026. The venue was an exacting first test, combining dining with bowling experiences and group requests. Onboarding meant sitting with BHC’s team, mapping caller flows and understanding how those experiences were sold through OpenTable.
“The Tablevoice experience at High Rollers has been the most successful AI implementation across all our venues to date.”
Built around the venue
The conversation started with listening.
For BHC, the quality of the implementation mattered alongside the quality of the AI Host. The High Rollers launch included time in the venue, support for the team and attention to the booking paths that made its operation distinctive.
“Marc thought of flows and pivots that we would have overlooked if he hadn't spent the time to truly understand our business and how we use OT experiences - specifically to sell bowling.”
The rollout expanded to 13 more former Slang venues in June. The phone numbers and teams remained familiar. A new AI Host—and an implementation shaped with those teams—was now handling the conversations.
02 / The migration, measured
A bigger result.
An equal window.
To make the comparison straightforward, each venue gets the same amount of time: 30 full days before its switch and 30 full days after. Across those windows, phone AI bookings rose from 505 to 1,465—an increase of 190%. The number of guests booked grew at almost the same rate.
Phone AI bookings
Reservations created through phone AI
Booked covers
Guests included in those reservations
30 full days on each side of every venue’s switch. Launch day, known tests and no-shows excluded. 505 → 1,465 AI bookings; 2,163 → 6,292 booked covers.
In the matched month, Tablevoice’s period recorded 960 more bookings and 4,129 more booked covers.
From the venue floor / LUPO
More attention
for the guests
already here.
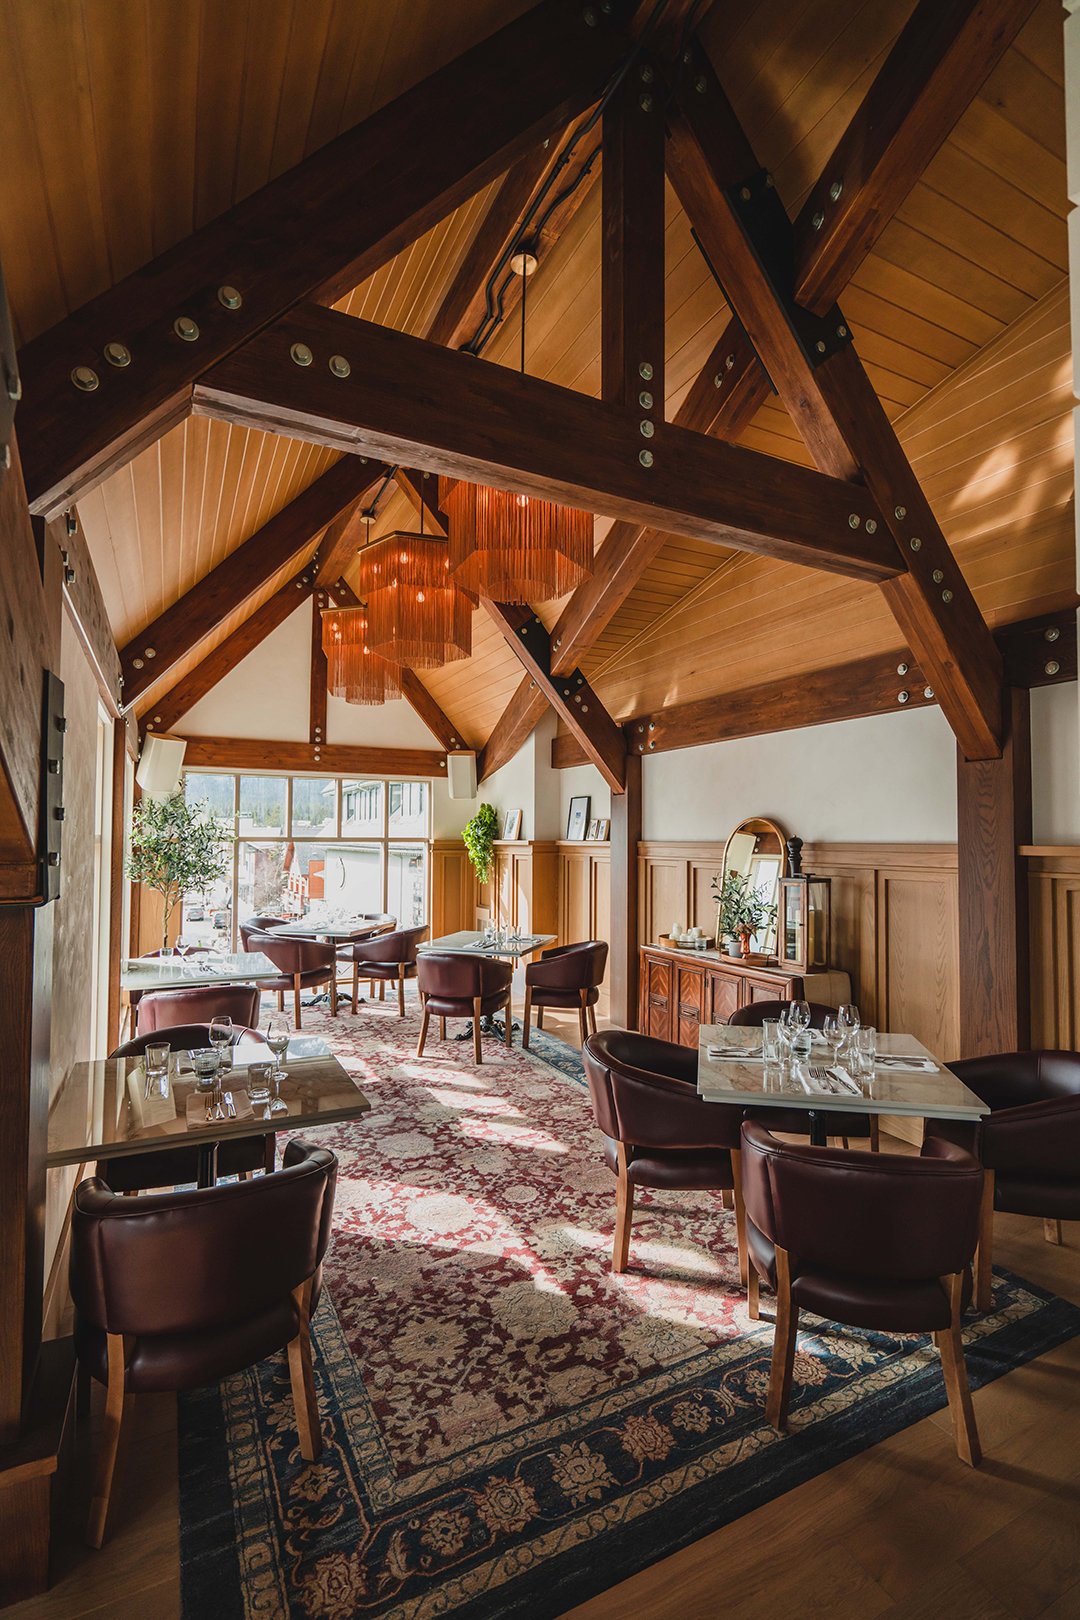
“We can focus on the guests that are actually here, the walk ins are coming in armed with information and it's changed the interaction with them so much”
Jerry’s observation adds something the reservation counts cannot measure: what changes at the front desk when guests arrive with useful information, and the team can give the people in front of them more attention.
03 / A better guest conversation
The booking is only part of the experience.
Some guests need to move a reservation. Others are running late, asking about a waitlist or looking for an alternative when a venue is full. Those conversations shape the guest’s experience even when they do not create a new booking.
At LUPO, Jerry and his team developed short, personal text responses for common requests. Tablevoice brought those responses into the platform, preserving the team’s wording and making them easier to maintain and send.
“Guests are responding well and feel that we've made every effort to satisfy their request, even when we aren't able to accommodate their booking request.”
That partnership continued after launch. The teams refined walk-in guidance, request filtering and guest-response shortcuts as they learned from real interactions. In August, Jerry put it simply: “Constant and never-ending improvement—I love it.”
04 / Putting the result in context
The result holds up
beyond one comparison.
Most of the rollout happened as Banff moved into summer. Demand was changing, so the before-and-after total deserves context. Other booking channels grew by 33% in the same venue-specific windows. Phone AI grew by 190%.
Growth beyond the baseline
Indexed volumes · 30-day windows
The whole phone channel grew
Team-entered phone + phone AI
05 / The value in the records
More bookings.
More recorded spend.
OpenTable’s populated POS records also show a substantial difference. Subtotal associated with the phone AI bookings rose from CAD $81,892 to $213,111 in the matched 30-day comparison.
That is $131,218 more recorded subtotal. It is spending attached to those booking records, rather than a model based on an assumed average check.
POS coverage is incomplete and differs between periods. These figures are not a claim of incremental revenue caused by Tablevoice.
Recorded POS subtotal
CAD · associated with phone AI bookings
06 / Earning the team’s trust
When the team asks for more.
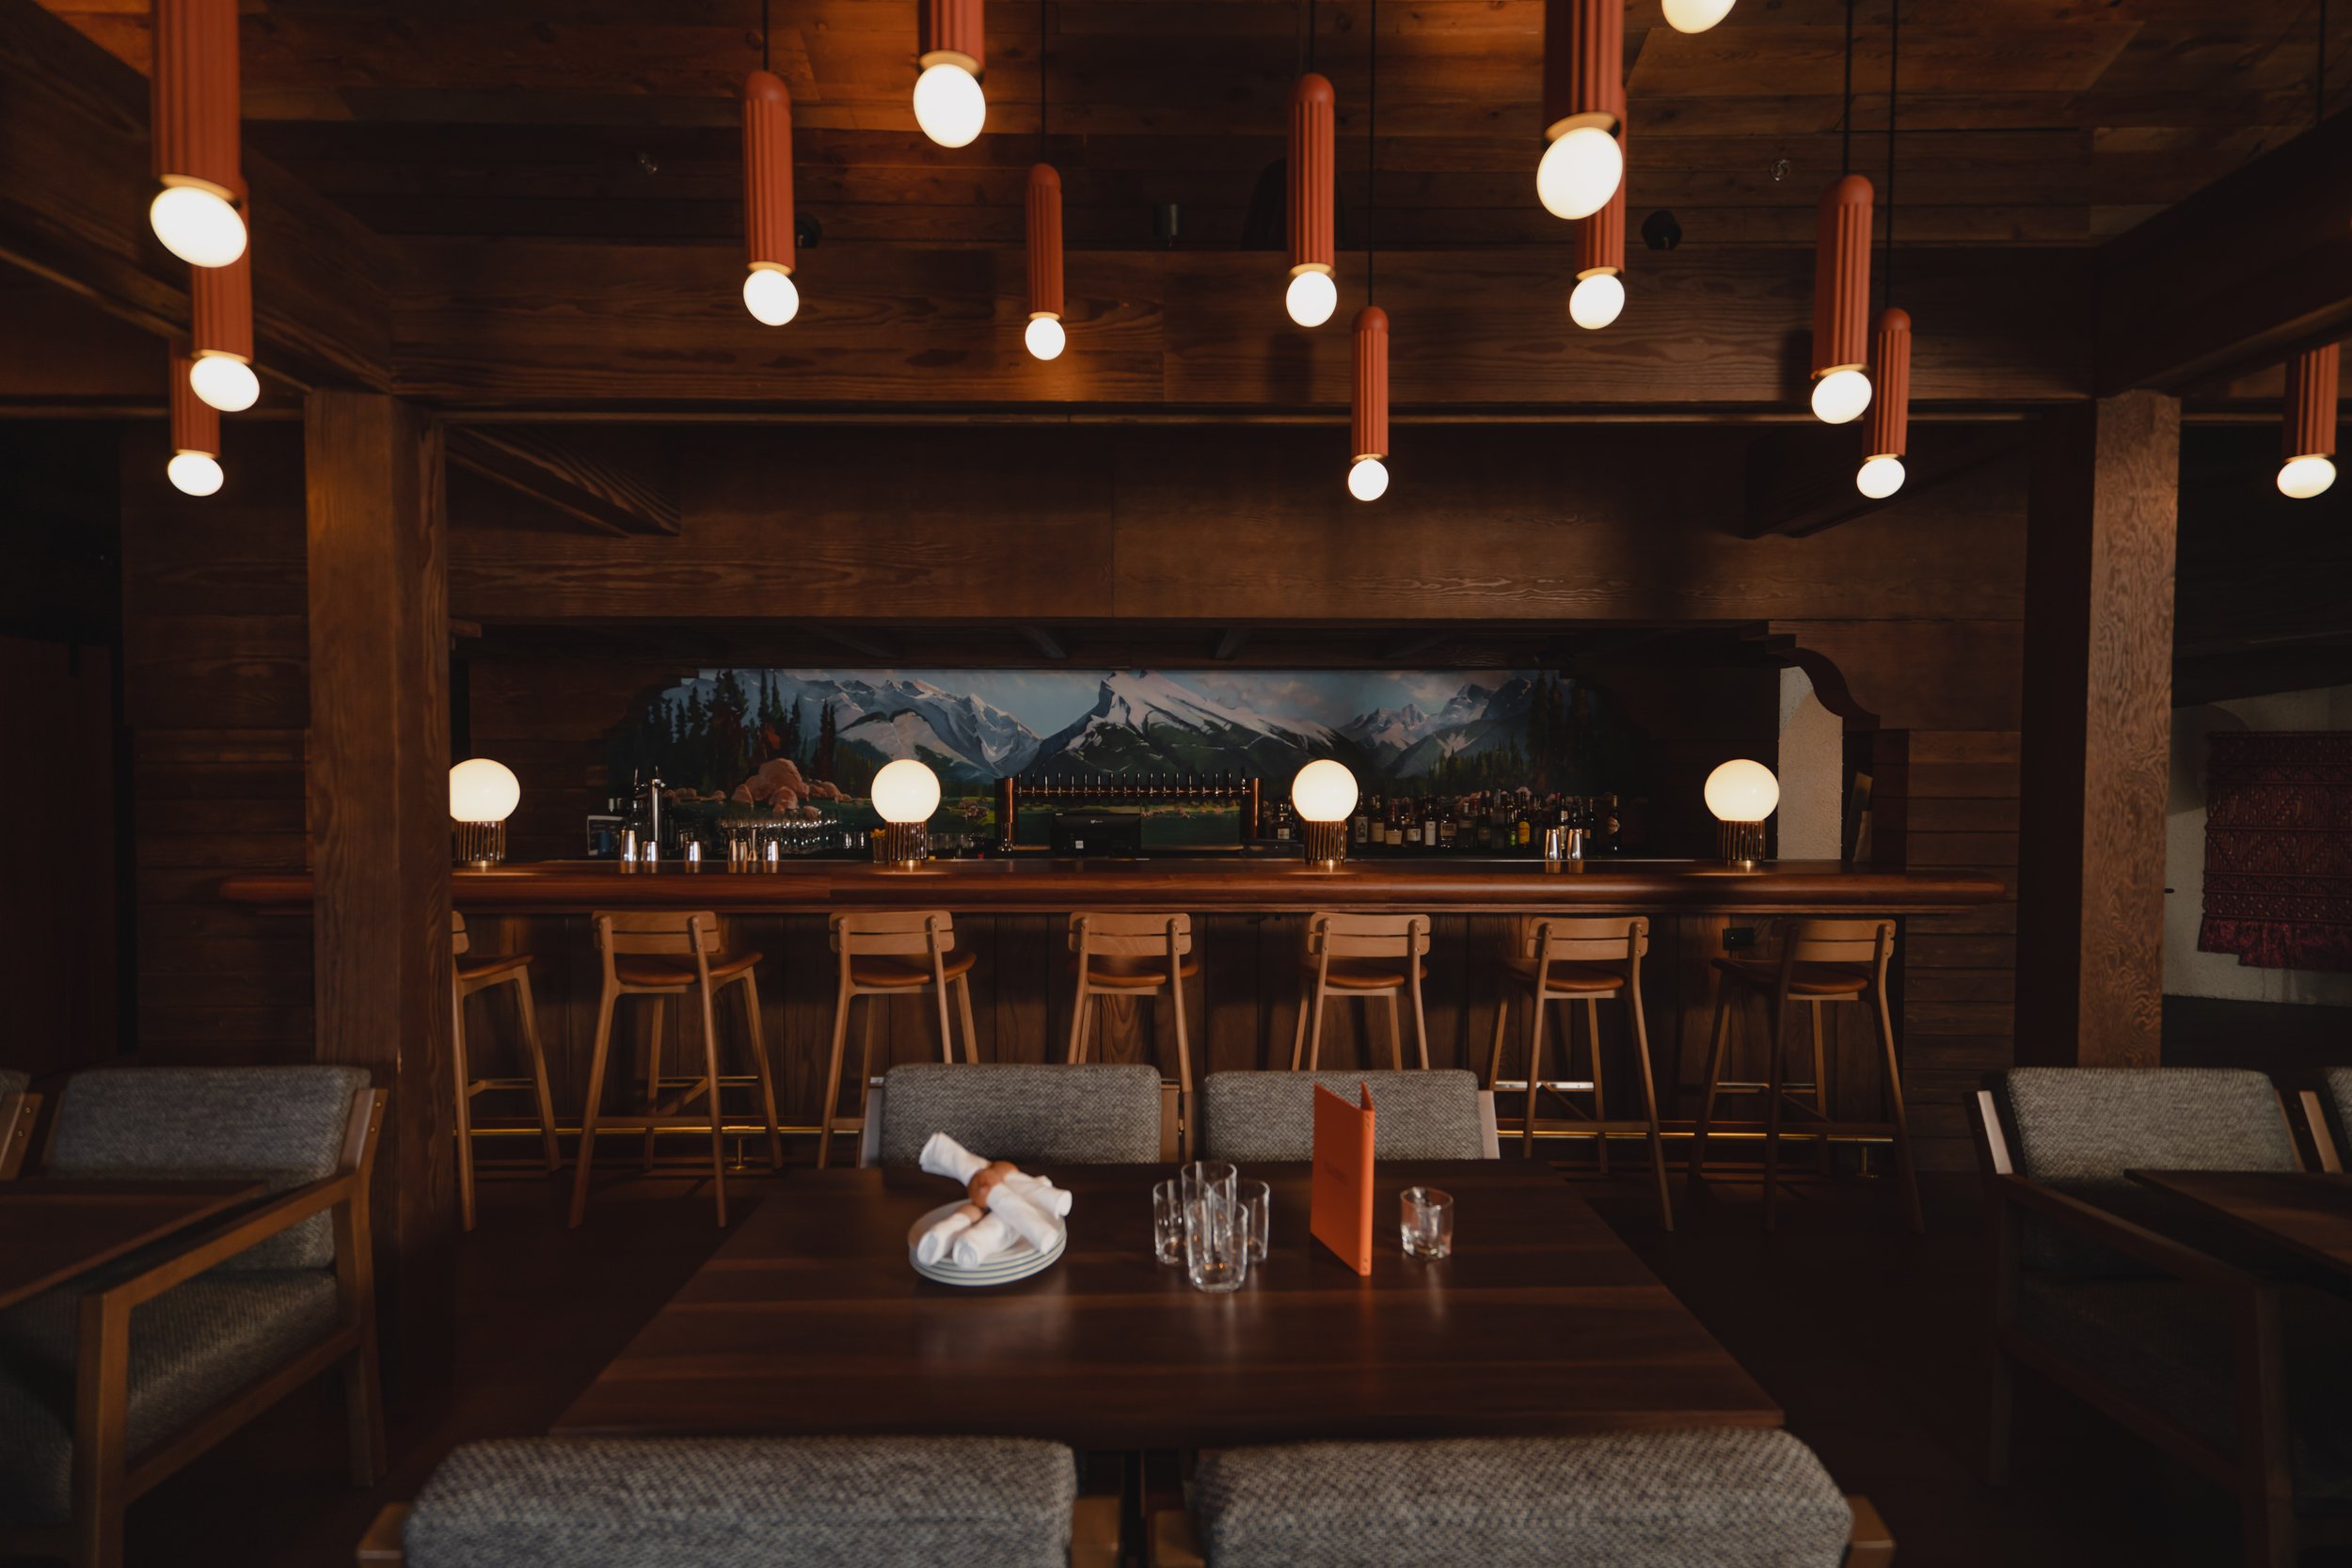
At Maple Leaf, the initial setup rang the venue’s phone before the AI Host answered. On July 2, the venue asked to move straight to AI answering, with the phone ringing when a guest wanted to reach the team.
It was a practical request from a team experiencing the system during service. BHC’s President, Katie Tuff, replied:
“You have successfully converted the most challenging technological team in our company. Hats off to you all.”
For an organization with so many distinct venues, the rollout had to work for the people using it every day. Their questions and feedback helped shape the system throughout the migration.
A partnership the teams helped build
“Huge shoutout to your team and being so open to working with us and our teams on this implementation!”
“Excited to see it continue to grow as we tweak and perfect the system.”
A higher standard for phone AI
“If we knew then what we know today, I wouldn't look any further than Tablevoice for a Phone AI service provider.”
The results? Across 14 venues, the migration was followed by 2.9 times the phone AI bookings—and a guest experience the teams continued to make their own.
Methodology
A result you can inspect.
Prepared by Tablevoice using locally synchronized OpenTable records and Tablevoice operational data, extracted September 8, 2026. This is an observational provider-migration case study, not a randomized experiment or independent audit. All figures refer to 2026; monetary amounts are Canadian dollars.
01. The same venues and equal time windows
The cohort is 14 BHC venues that moved from Slang to Tablevoice. Each primary comparison uses 30 complete local days before launch and 30 complete local days after launch. Launch day is omitted to avoid mixing the two providers during the handover. All dates use America/Edmonton time.
Equal windows mean equal exposure time, not equal numbers of calls or bookings. Venue results are summed; each venue contributes 30 days per period. High Rollers launched April 1; the other 13 launched June 15–30. The periods therefore differ by venue.
02. What counts as an AI booking
Bookings are OpenTable reservation records with the Phone/AI source, grouped by when the reservation was created—not the date the guest was scheduled to visit. Records marked NoShow are excluded from both periods and from the July–August booking totals. The same exclusion applies to the other-channel comparisons. Covers sum the party sizes on the remaining records. Cancelled and future reservations remain unless explicitly stated otherwise.
The sync data does not distinguish voice providers in the partner field. Slang and Tablevoice attribution is inferred from each venue’s transition date, checked against launch correspondence and sustained call activity. Any overlap between providers cannot be separated record by record.
03. Launch dates, tests and sensitivity checks
The transition dates combine the sharp change in production call activity with contemporaneous launch emails. Known internal booking profiles and associated phone aliases, plus Tablevoice email identities, are excluded consistently from both periods. After excluding no-shows, 35 earlier and 23 later internal AI bookings are also removed. Undetected tests may remain.
With no-shows excluded but identified tests included, the comparison is 540 → 1,488 bookings, or 2.76×. Excluding both High Rollers and PARK gives 484 → 1,260 bookings, or 2.60×. The primary booking ratio is 1,465 ÷ 505 = 2.90×.
04. Seasonality and causal limits
Other channels include team-entered phone, web, walk-ins, Tripleseat and remaining sources. The descriptive benchmark multiplies each venue’s earlier AI bookings by that venue’s after/before ratio for other-channel records, then sums the results: approximately 667 expected versus 1,465 observed, or 2.20×.
Other channels are not untreated controls. Seasonality, demand, availability, routing, training and configuration can affect results. Maple Leaf moved to AI-first answering during its after period; LUPO’s forwarding setup was refined after launch. The study measures the migration and its implementation together. It does not prove that changing the AI model alone caused the increase, or that every additional booking was incremental.
05. Booking outcomes and POS coverage
The earlier gross comparison contained 55 and 185 no-shows; removing them gives 505 → 1,465 bookings. Of these, 76 and 228 are cancelled. Removing cancellations as well gives 429 → 1,237 bookings (2.88×). A stricter attendance check finds 419 → 1,215 bookings with a recorded seated timestamp and Done or AssumedDone status—2.90×—with 1,748 → 5,164 covers. The remaining uncancelled records are AssumedSeated (8 → 13) or future NotConfirmed reservations (2 → 9). This distinction is why the main measure is labelled bookings rather than verified visits.
Revenue figures sum recorded POS subtotal attached to these bookings. Values are $81,892.47 → $213,110.59, a $131,218.12 difference. POS subtotal is populated for 74.1% of earlier and 68.5% of later records. Missing values are not estimated. Booked visits and POS outcomes can mature after extraction.
06. The July–August box and its scope
The separate update covers July 1 through August 31, 62 days, for the same 14 venues. Bookings exclude no-shows and use creation dates; calls use call dates and exclude identified internal/test, junk and human-only traffic. Outside-hours counts follow configured opening hours. Calls are not unique guests, and group-request calls are not confirmed group bookings.
Bluebird’s recorded closure affects August. High Rollers has no recorded AI-associated POS subtotal in August; that is a coverage limit, not evidence of no guest spending. Calendar POS coverage is 64.0% of the 2,681 bookings remaining after the no-show exclusion. Dusty Boot, PARK tours and the BHC office are outside this cohort. Dusty Boot moved from Hostie and lacks the synced before/after data needed for this comparison.
Venue dates and booking counts
| Venue / switch | 30-day windows Before / after | 30-day bookings | 30-day covers |
|---|---|---|---|
| High RollersSwitched Apr 1 | Mar 2–Mar 31Apr 2–May 1 | 10 → 88 | 80 → 513 |
| Chuck'sSwitched Jun 15 | May 16–Jun 14Jun 16–Jul 15 | 31 → 93 | 99 → 311 |
| LUPOSwitched Jun 15 | May 16–Jun 14Jun 16–Jul 15 | 44 → 111 | 147 → 344 |
| BisonSwitched Jun 17 | May 18–Jun 16Jun 18–Jul 17 | 30 → 78 | 85 → 235 |
| BluebirdSwitched Jun 17 | May 18–Jun 16Jun 18–Jul 17 | 78 → 181 | 267 → 701 |
| Three BearsSwitched Jun 17 | May 18–Jun 16Jun 18–Jul 17 | 68 → 168 | 378 → 745 |
| Bear StreetSwitched Jun 22 | May 23–Jun 21Jun 23–Jul 22 | 46 → 97 | 243 → 494 |
| Magpie & StumpSwitched Jun 22 | May 23–Jun 21Jun 23–Jul 22 | 51 → 112 | 251 → 618 |
| Eddie BurgerSwitched Jun 23 | May 24–Jun 22Jun 24–Jul 23 | 15 → 37 | 61 → 124 |
| Hello SunshineSwitched Jun 23 | May 24–Jun 22Jun 24–Jul 23 | 27 → 103 | 91 → 434 |
| Pizzeria SophiaSwitched Jun 23 | May 24–Jun 22Jun 24–Jul 23 | 20 → 78 | 65 → 273 |
| BalkanSwitched Jun 24 | May 25–Jun 23Jun 25–Jul 24 | 52 → 112 | 265 → 492 |
| Maple LeafSwitched Jun 24 | May 25–Jun 23Jun 25–Jul 24 | 22 → 90 | 81 → 333 |
| PARK DistillerySwitched Jun 30 | May 31–Jun 29Jul 1–Jul 30 | 11 → 117 | 50 → 675 |
| All 14 venues | 30 days per venue, per period | 505 → 1,465 | 2,163 → 6,292 |